- 12 June marks 100 days since the first known Covid-19 patient arrived back in the country from a trip to Italy.
- As of Thursday, 58 568 cases have been recorded, more than one million tests were conducted across private and public labs, while 1 284 deaths have been recorded.
- The infection rate is now higher than at any point previously in the outbreak.
Graphic representations of reported Covid-19 data can make analysis of the numbers much easier. We take a look at some of the key graphs that map progress in the fight against the coronavirus outbreak, and how it has spread.
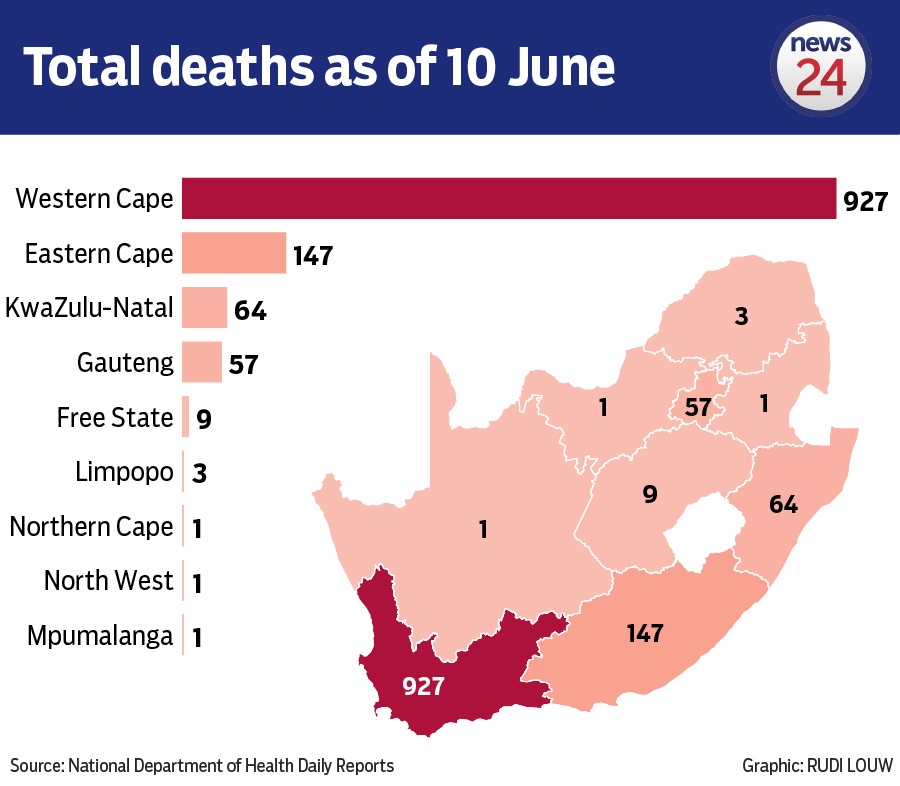


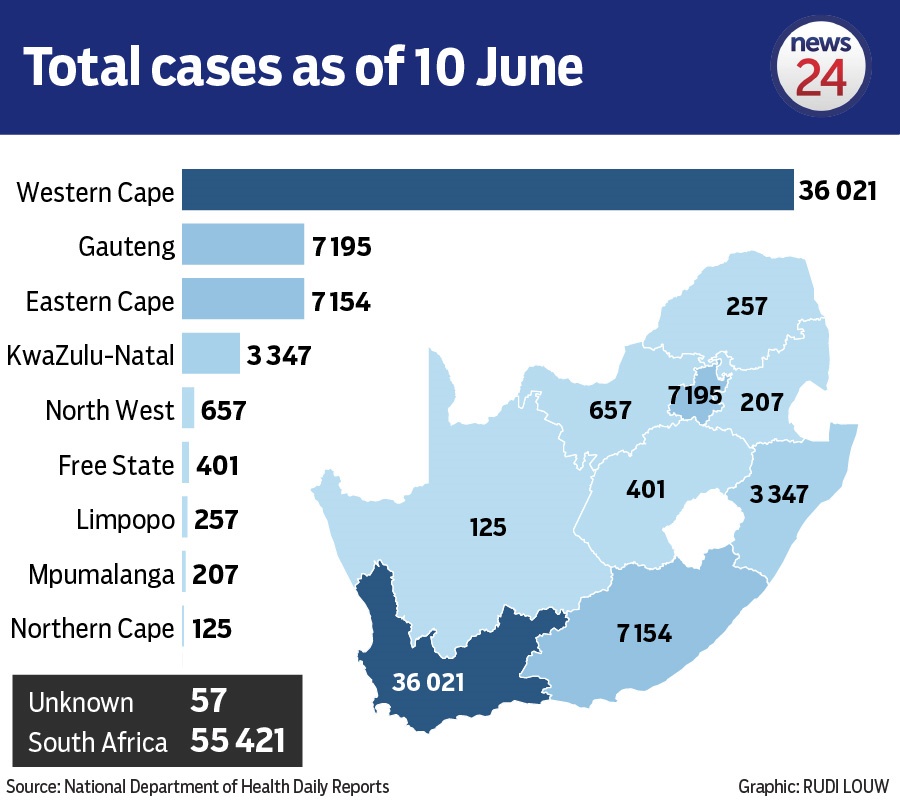


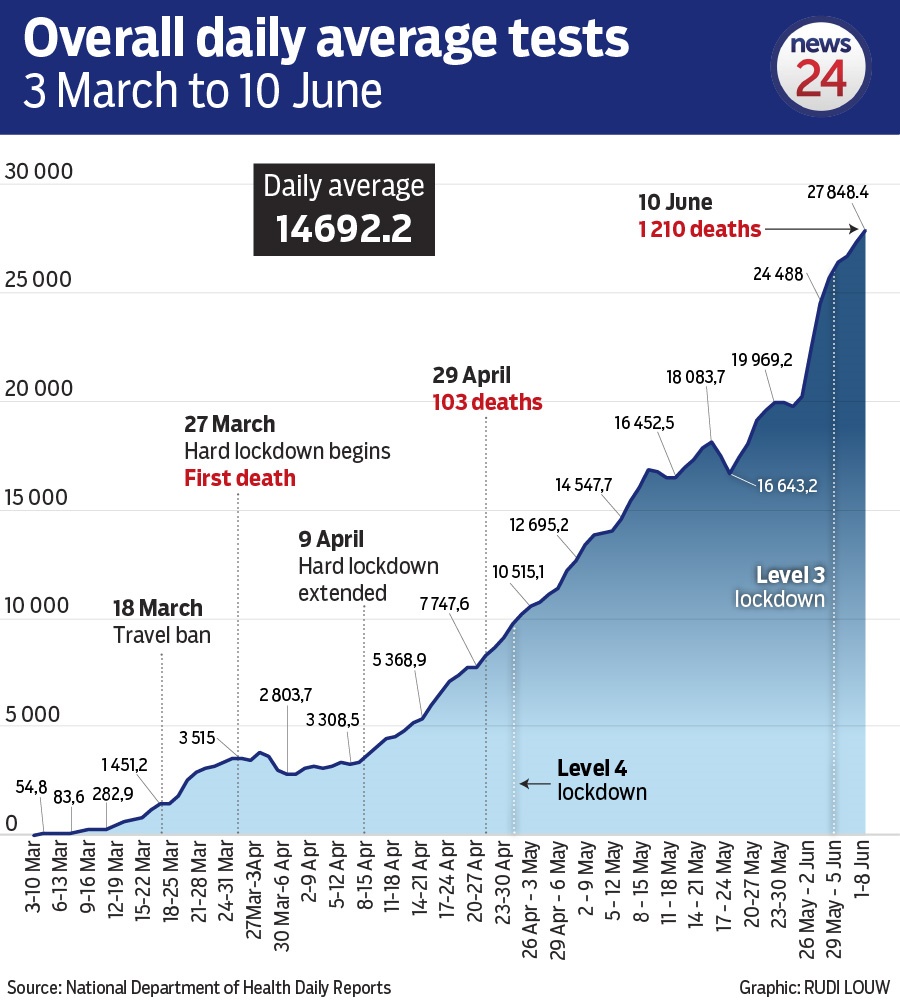


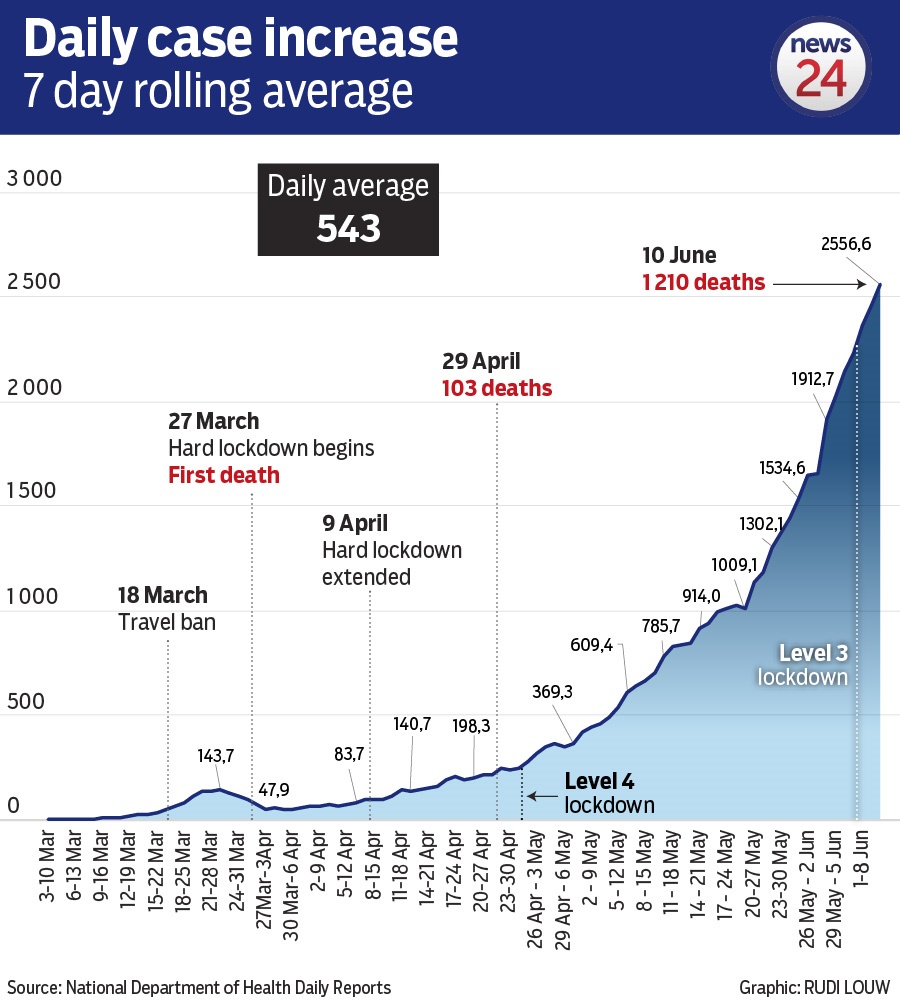


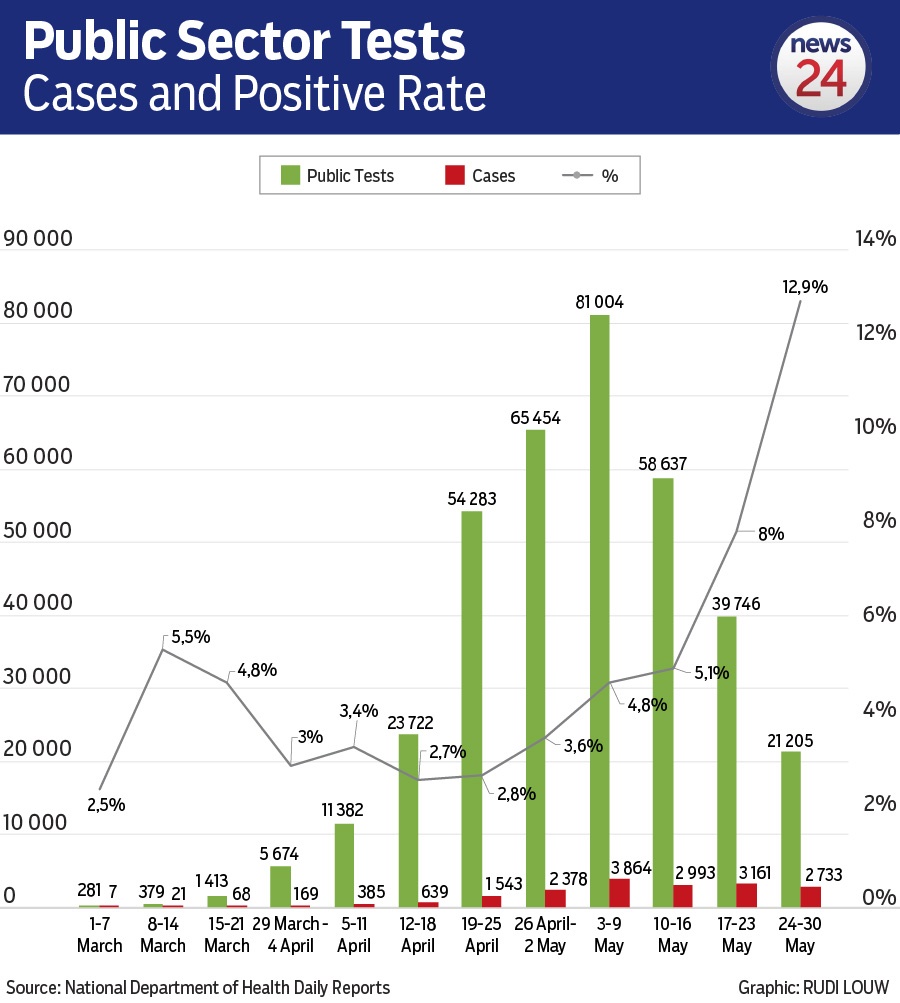


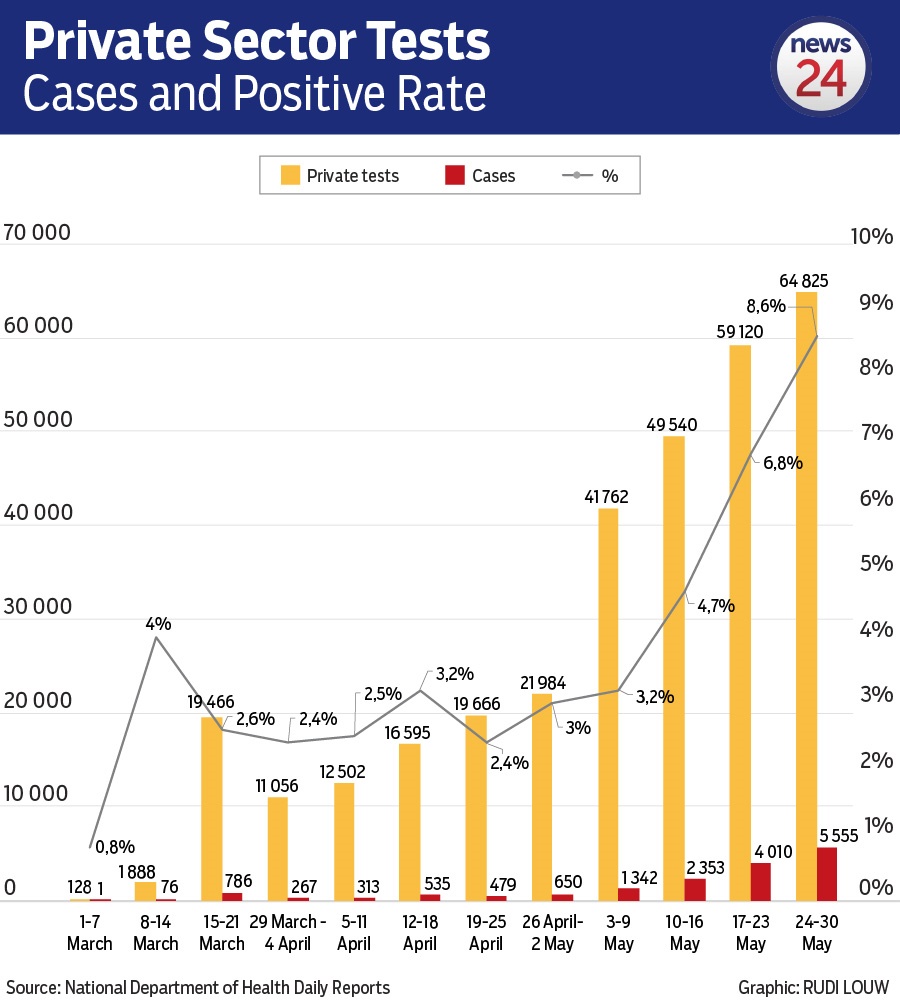


All the data used to compile these graphs was sourced from the national Department of Health and reports published weekly by the National Institute for Communicable Diseases.
Next on News24
100 days of Covid-19 l Government failed to implement a proper testing strategy – experts
9h ago


